Evaluating the best method for monitoring wildlife to understand biodiversity changes

Alex Wright is helping conservationists optimize data collection to answer complex biodiversity questions at large scales. While studying for his Ph.D. at Michigan State University in Elise Zipkin's Quantitative Ecology Lab, Wright and his Ph.D. advisors set out to determine the best way to monitor wildlife to understand how biodiversity changes through time and space. Their paper, “A comparison of monitoring designs to assess wildlife community parameters across spatial scales,” was recently published in Ecological Applications.
To determine the optimal monitoring method for a given question, Wright and his team ran a simulation study using amphibian data from the National Capital Region Network—the 11 national parks within and around Washington DC. Biodiversity in this area is threatened by climate change and urbanization, and amphibians are considered an indicator species in these parks—their presence is presumed to correlate with the overall health of the ecosystem. Therefore, collecting amphibian data across this network has been a priority for more than two decades.

Amphibian data are used for multiple objectives across different scales, so they represent an ideal case study for evaluating monitoring alternatives. For example, the network is interested in the status and trends of biodiversity across all parks, but the management decisions needed to address the drivers of those trends are often made, and implemented, at local park-level scales.
“Evaluating multiple processes for multiple species simultaneously is a tricky endeavor,” said senior author Elise Zipkin, associate professor in Integrative Biology and director of MSU’s Ecology, Evolution, and Behavior (EEB) Program. “But it’s increasingly important as biodiversity continues to decline and the objectives for conservation become more nuanced, varying within and across geographic regions.”

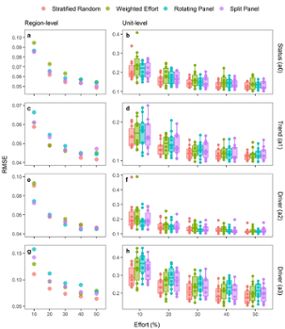
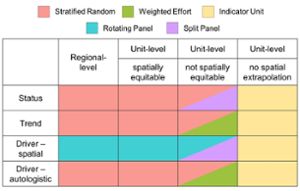
Wright and his team compared commonly used monitoring protocols using a hierarchical community model. This model enabled them to understand information tradeoffs between local and regional scales. They evaluated five common monitoring designs—stratified random, weighted effort, indicator unit, rotating panel, and split panel—to estimate status (how many), trends (increasing or decreasing), and drivers (factors that influence the status and trends) of individual species and the whole community at two spatial scales (local and regional). Previous studies have accounted for spatial variation, but none have balanced the need to address multiple objectives at different scales.
“Being published in Ecological Applications is important to me because it’s a journal that focuses on the application of science to solve real world problems—something I’m passionate about,” said Wright, currently a Conservation Biologist for the U.S. Fish and Wildlife Service. “Our paper is quite practical; once conservationists identify their monitoring objectives, they can use one of the processes we describe to accomplish their goals.”
So, what is the best method for monitoring biodiversity? The answer depends on the questions being asked. Researchers must first decide on their monitoring objective. Then they need to determine what information is needed to fulfill that objective, including the specific parameters of interest and the appropriate spatial scale for inference.

Wright’s team found that the stratified random design outperformed the other designs for most parameters at both scales and was generally preferable in balancing the estimation of status, trends, and drivers across scales. However, the team also found that other designs had improved performance in specific situations. For example, the rotating panel design performed best at estimating spatial drivers at a regional level.
“Alex’s work is really unique because he continually circles back to a single central question: what information do managers need to improve conservation?”, said Zipkin. “This study offers concrete guidance to managers on balancing common tradeoffs in large-scale and long-term monitoring programs.”
Wright now works as a Conservation Biologist at the U.S. Fish and Wildlife Service to support the Midwest Landscape Initiative. In that role, he works with diverse stakeholders to define and reach shared landscape conservation goals. His work guides voluntary conservation actions and investments across the region and ultimately, is meant to improve conservation outcomes at both regional and local scales.
“This work is important to me because it can help managers make informed decisions in what are often really complex ecological systems with a lot of uncertainty,” said Wright. “Ultimately, we hope it leads to improved conservation outcomes across landscapes and for multiple stakeholders.”
Banner image: U.S. Geological Survey technicians collecting water samples for the detection of wildlife diseases at wetlands within the regional amphibian monitoring program. Photo credit: United States Geological Survey